HPD Suite
One Feature, One Time.
Eliminate Redundancy in Data Management with the CARIS Hydrographic Production Database (HPD). Using Oracle® data processing, HPD offers an integrated suite of applications, providing for simultaneous data processing and workflows by multiple users. Efficiency is maximized for data storage with features being stored only once, with the ability to create multiple representations for different products.
Manipulate, analyze and compile data using intuitive CARIS tools, and create products with confidence.
Implement the HPD suite of products for production of S-57 and S-101 ENCs, S-57 IENCs, S-57 AMLs, Paper Charts to IHO standards, or the creation and maintenance of non-chart Nautical Publications and Generic Products based on user-defined sets of features. The HPD editors derive products from the source data in the same database. Updates to source are carried automatically to multiple products. Product-specific features and customizations can be made concurrently without affecting the source features.
In support of the new S-100 data standard, users can now create S-100 products in HPD. Users can gain familiarity with the new complex and multiplicity attribute types, work with information types, assign S-100 portrayal to features, convert ENC and DNC to S-101 and work with the expanding registry of S-100 product specifications.
Part of the Ping-to-Chart solution

Feature Highlights in version 5
Teledyne Geospatial is pleased to announce the release of CARIS HPD 5.0.
*Note - An updated license file will be required to use CARIS HPD 5.0, S-100 Composer 5.0, S-57 Composer 5.0 and Paper Chart Composer 5.0.
NOV 2, 2023
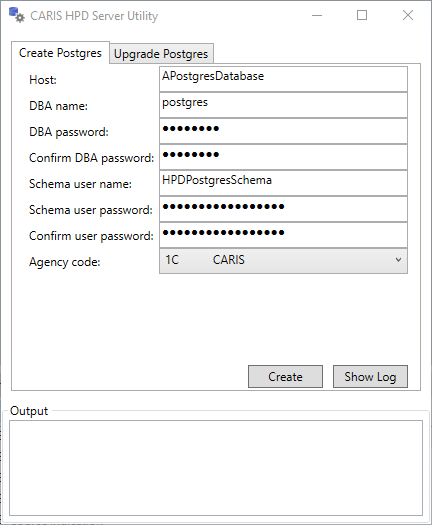
HPD Server for PostgreSQL
CARIS HPD 5.0 introduces support for the open-source PostgreSQL database as a lower-cost enterprise option.
- PostgreSQL 15 and PostGIS 3.3 and later versions are supported.
- CARIS Server Utility and CARISBatch can be used to create an HPD schema on a PostgreSQL database.
- An HPD Server for PostgreSQL licence is required to use PostgreSQL as a database.
*Note: HPD API views are supported with PostgreSQL, but other API calls are not.
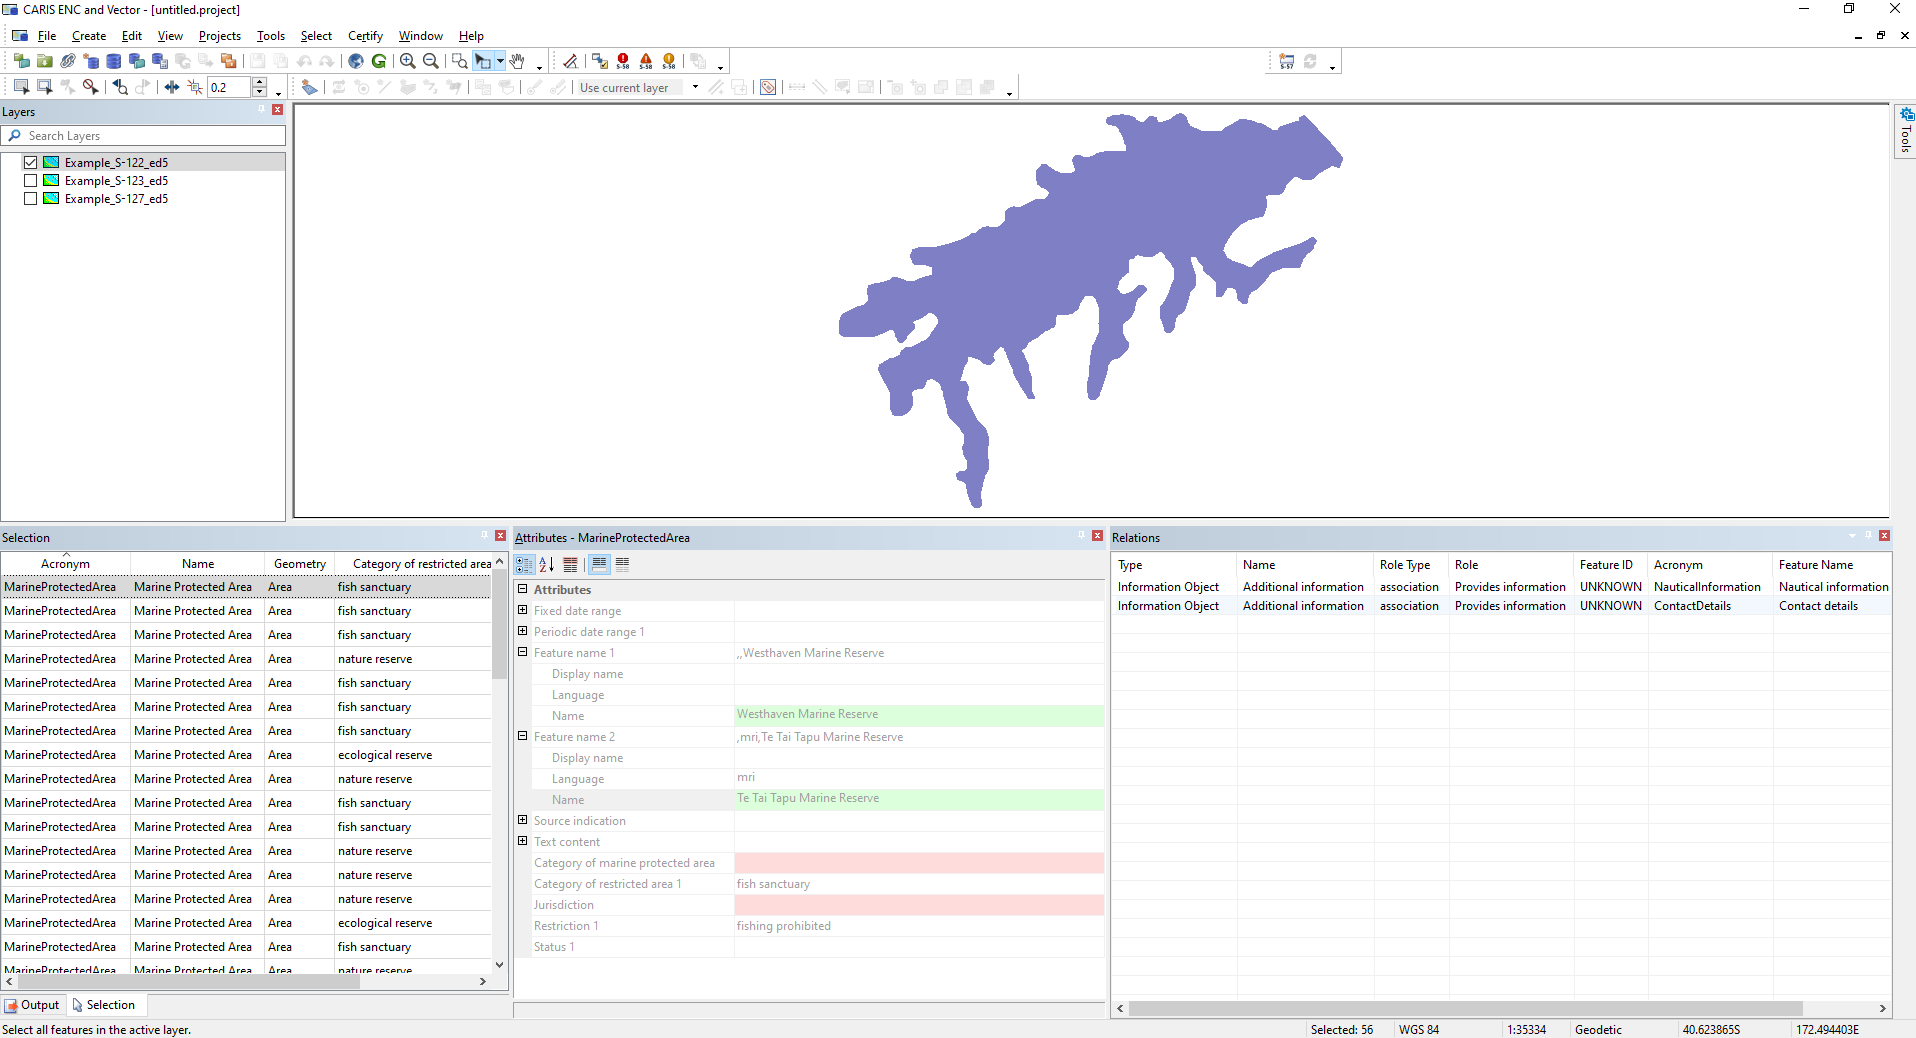
Updated S-100 and S-101 Support
HPD 5,0 and S-100 Composer 5.0 includes support for S-100 Edition 5, and support for production of S-101 Edition 1.1.0 ENCs. In addition, has HPD 5.0 and S-100 Composer 5.0 been tested with various S-100 product specifications, including S-122 Marine Protected Areas, S-123 Marine Radio Services, S-127 Marine Traffic Management, S-401 Inland ENC. System files, such as feature catalogues, as not installed with the software, but can be requested by contacting the CARIS Customer Service Team.
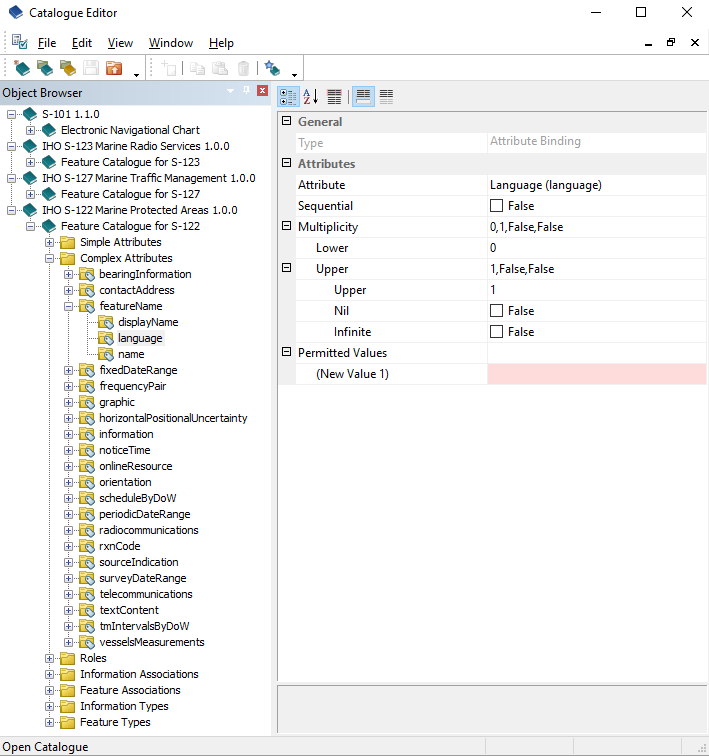
New S-100 Catalogue Editor
The new S-100 Catalogue Editor allows for editing and validation of existing S-100 feature catalogues and creation of new ones.
Feature and attributes can be added, edited and removed from feature catalogues, associations can be defined, etc., now with support for S-100 feature catalogues, to be used in CARIS and for other platforms supporting S-100 feature catalogues.
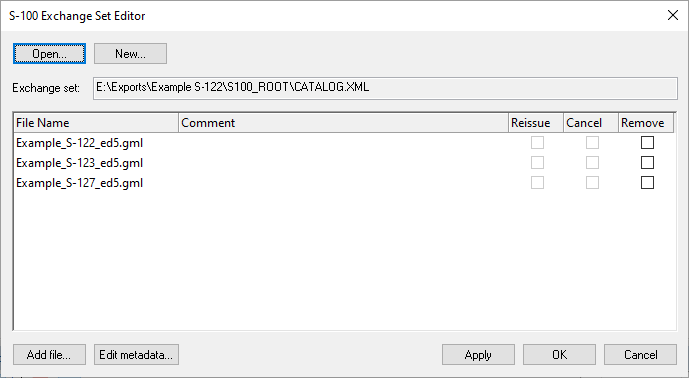
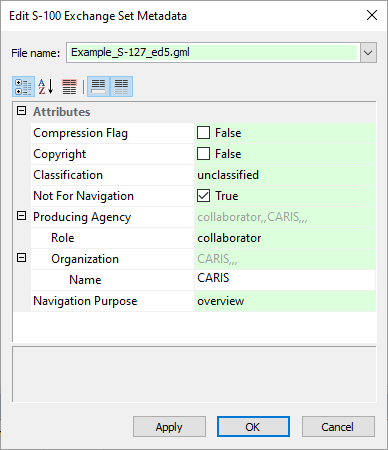
New S-100 Exchange Set Editor
S-100 Exchange Set Editor can be used to package S-100 datasets ready for distribution.
Files can be added and removed from S-100 exchange sets, with support for S-101 exchange sets as well as support for other product S-100 product specifications, including those using the GML file format.
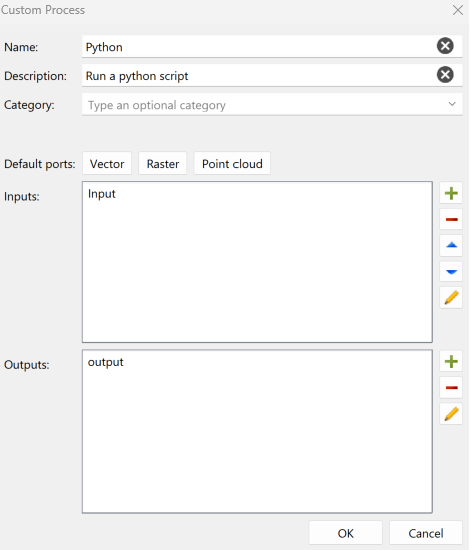
Automation Enhancements
To integrate with third party solutions or to include their own business logic, users can now create custom processes written in python script. These processes can be used within CARIS Process Designer to add flexibility in process model design. Additionally, CARISbatch can now launch process models. With the combination of these different functionalities enhanced CARIS automation tools, it is now possible to execute automated workflows across CARIS applications.
Log generation is supported when scripted processes are run.
These different tools allow users to use a single application as a hub for their automation launch.
Python support
Python scripting is a flexible way to put HPD to work in automation workflows, and now, users can enjoy support for version 3.9, 3.10 and 3.11. Updating to new versions of Python help safeguard IT infrastructure, so join CARIS in upgrading today.
To view a full list of product enhancements available visit the CARIS HPD What's New page.
Source Editor
A desktop application for compiling and generalizing source data
Access the latest tools for creating and editing source data in preparation for product creation with one of the HPD product editors. Access source data from the HPD database or import from external datasets for easy updates to existing data. Organize and track changes to your source data with customizable display styles, effective filtering and marker functionality. This application is designed for managing data on multiple scale bands for multiple product types and ensure your data quality with a comprehensive set of validation checks.
HPD Server
Incorporating the latest database driven technology for storing and managing source data
Eliminate data redundancy and efficiently track changes between the source data and multiple products with the power of Oracle® database. The HPD data model supports real-world objects defined by a combination of descriptive and spatial characteristics based on the IHO S-57 data structure.
The HPD data model and the HPD Publications application provide the means to create custom catalogues that are suited to your publication needs. Multiple versions of an IENC product (i.e IENC 2.1, 2.2, 2.3 and 2.4) can be created in the Product Editor from the same HPD Source data.
The HPD Server provides you with an API library that allows HPD to be linked to third-party systems.
The HPD Server comes with administration tools to create users, configure database usage and assign user roles with the associated access and functionality. Customize your database dictionary, as required, to add organizational-specific features. Manage workflows with comprehensive project and source registry tools.
Product Editor
A desktop application for compiling and exporting S-57 and S-100 vector products
HPD Product Editor is a next-generation database application for the production of S-57 Electronic Navigational Charts (ENC), Inland Electronic Navigational Charts (IENC), Additional Military Layers (AML) and Geographic Markup Language (GML) products.
Obtain quality and efficiency in creating and updating S-57 products. HPD Product Editor utilizes a comprehensive set of tools for the production of S-57 ENC, IENC, AML and GML products created from HPD source data and external data sources. Customized product features and graphical depictions can also be used with each product line without affecting the source data. The Product Editor provides built-in quality control checks to ensure compliance with the S-57 and S-58 standards.
Paper Chart Editor
A desktop application for compiling and publishing paper chart products
Improve efficiency in managing paper chart products using the capabilities of the HPD database. Paper Charts in either vector or raster format can be created from the same HPD source, thereby eliminating duplication of data compilation and maintenance. Utilize the standard cartographic presentation in the HPD Paper Chart Editor based on the IHO S-4, INT1, INT2 and INT3 specifications or customize your own presentations for organization-specific products. Powerful raster charting tools are also available. Both vector and raster paper charts can co-exist in the same HPD database. Organize and track changes to your source data with flexible filtering and marker functionality, including ties to the Publications Module.
Related Products
Technical Specifications
| HPD Desktop Applications | |
|---|---|
| Component | Recommended |
| Processor | Recent generation multi-core CPU |
| Memory | 16 GB of RAM |
| Storage | 7200 RPM disk drive or solid-state drive, minimum 1 GB available for installation |
| Display | NVidia or AMD display adapter with 512MB of memory or greater NVidia or AMD display adapter, with an OpenGL 3.3 compatible GPU, with 2GB of memory or greater (for HPD application use of 3D visualization) |
| Operating System | Windows 10 Professional 64-bit, or Windows 11 Professional 64-bit |
| Software | Oracle 19c Client (for Oracle connections) |
| HPD Server | |
| Component | Recommended |
| Software | Oracle 19c Standard Two or Enterprise Edition |
Downloads
Suggested Reading
| Document | Type |
|---|---|
| Chart Management and Production for Swedens Coastline | |
| Cartography at the Source |